FTD dashboard
The FTD dashboard is a monitoring interface that
-
provides an at-a-glance view of the status and events data collected by all Security Cloud Control-managed Firewall Threat Defense devices
-
displays collective information related to device status and overall health of devices in your deployment, and
-
uses tabs with predefined widgets that provide insights into different aspects of the system.
FTD dashboard capabilities
The information that the FTD dashboard provides depends on how you license, configure, and deploy the devices in your system. The FTD dashboard displays data for all Security Cloud Control-managed Firewall Threat Defense devices, but you can choose to filter device-based data. You can also choose the time range to display for specific time range.
This dashboard uses tabs to display predefined widgets: small, self-contained components that provide insights into different aspects of the system. For example, the Network Activity widget shows you event graphs that display information about all connection, malware, and intrusion events. The widgets in the dashboard are predefined and cannot be customized. This dashboard is visible to all Security Cloud Control users who have access to a Security Cloud Control tenant.
-
The dashboard does not displays any event statistics for historic events.
-
Since the aggregation service batch processes the events to aggregate every five minutes, you can expect a five-minute latency between the time the events are aggregated to the time the statistics are displayed.
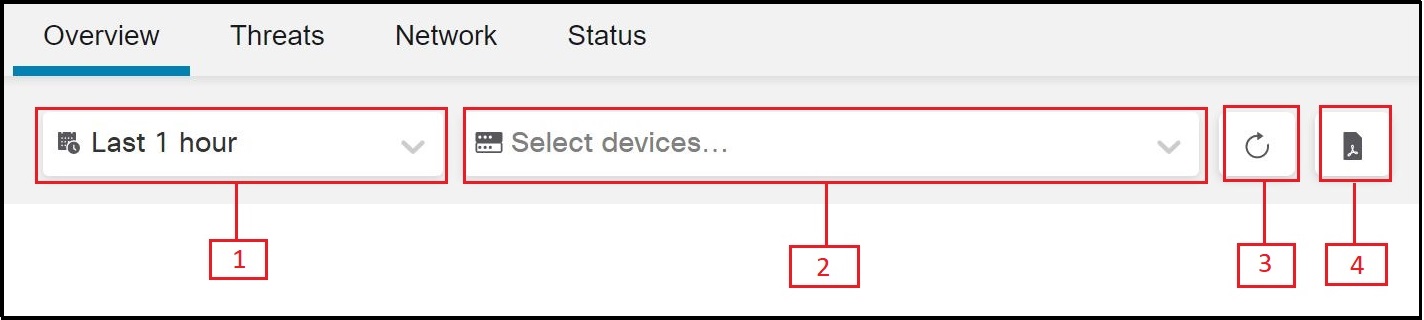
The dashboard provides these control options:
|
Number |
Description |
|---|---|
|
1 |
Allows you to change the time range to reflect a period as short as the last hour or as long as the last year. When you change the time range, the widgets automatically update the events data to reflect the new time range. |
|
2 |
Allows you to filter the events data based on selected devices. If no devices are selected, the widgets display all available events data. |
|
3 |
Reinitiates the events data query |
|
4 |
Displays the events data in a PDF output format. You can choose to download or save a copy of this PDF on your local machine. |