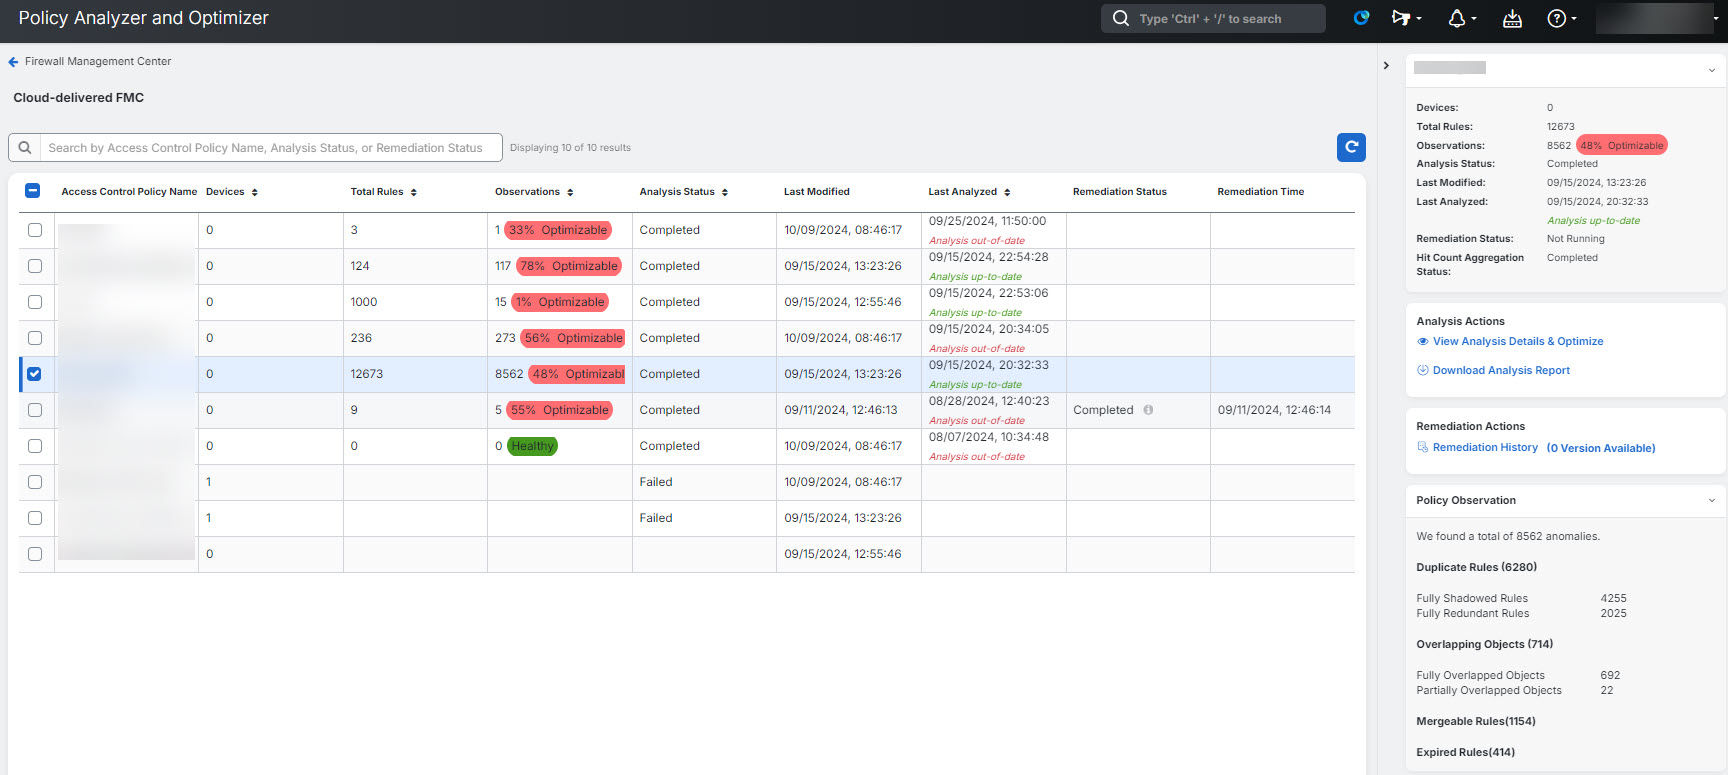
Access control policy analysis summary
When analysis completes, select an access control policy to review the right-pane summary and click View analysis details and optimize.
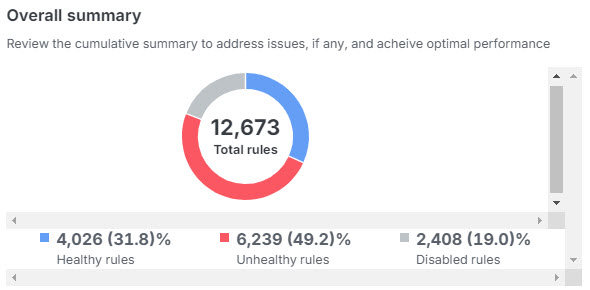
Overall summary—provides insights on how many rules are healthy, disabled, expired, and contain anomalies, using a pie chart for the selected access control policy. You can also hover over the part of the pie to view the percentage of rules.
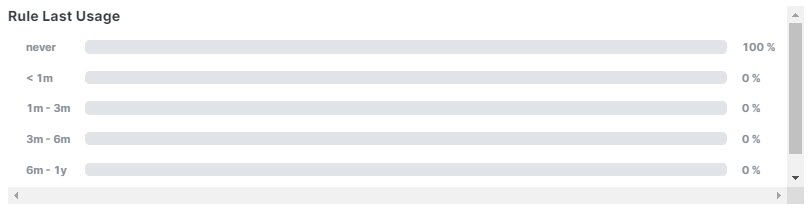
Rule usage history—shows how recently rules were used, with time periods.
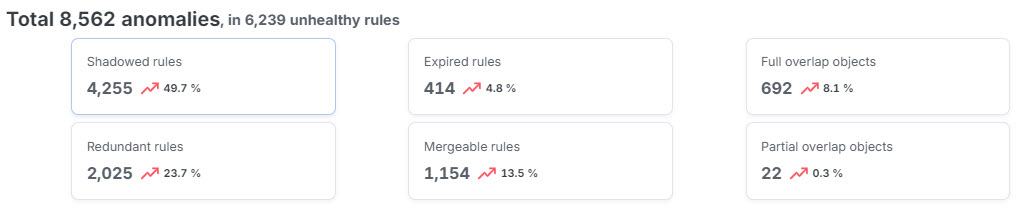
Rules with Anomalies—provides insights on how many rules have anomalies.
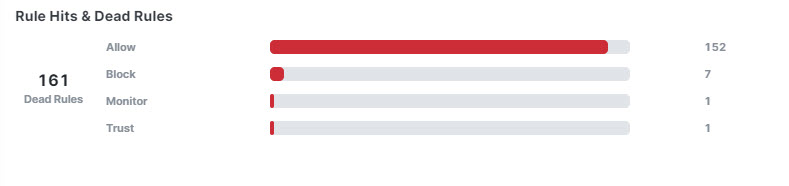
Hits rules & dead rules—provides insights on hitcount of expired rules, for rule types including allow, block, monitor, and trust.
In remediation tabs such as Duplicate rules, Expired rules, Mergeable rules, Overlapping objects, and Policy insights you can select the check box next to a category to stage all observations in that category, or expand the category and select specific observations or rules. Available actions depend on the anomaly type.